|
International Journal of Bioelectromagnetism Vol. 4, No. 2, pp. 229-230, 2002. |
www.ijbem.org |
The effects of sleep onset on late auditory evoked potentialsK.B. Campbell, A. Muller-Gass,
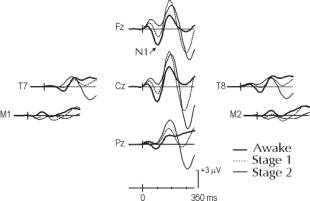
D.R. de Lugt Abstract: An auditory stimulus elicits a series of long-latency evoked potentials, the most prominent of which is a negative wave, N1, peaking at about 100 ms. N1 is claimed to be dependent on the physical features of the stimulus and independent of attentional influences. This study examines the influence of sleep onset on N1, because sleep is the period of time that subjects are least aware of their external environment. The EEG was recorded from 29 electrode sites. During sleep onset, N1 gradually decreased in amplitude reaching baseline level during stage 2 of sleep. A difference wave was computed by subtracting the ERPs in stage 2 from those in the waking state. This yielded a long-lasting negative wave, wNd. The scalp distributions of N1 and wNd did not differ. These findings suggest that N1 is markedly affected by inhibitory processes that prevent awareness of irrelevent auditory input. INTRODUCTIONAn auditory stimulus will elicit a series of long latency evoked potentials. Prominent among these is a negative wave, N1, recorded maximally over the frontocentral scalp, peaking at a latency of 80-120 ms [1]. The scalp distribution of N1 has been explained by complex sources in and around the auditory cortex [2]. N1 is claimed by many authors to be an obligatory response of the auditory system, influenced by the exogenous, physical parameters of the stimulus. Further proof of the exogenous nature of N1 is that it still occurs when subjects are asked to ignore the auditory stimulus. N1 is thus independent of endogenous, attentional influences [3]. The influence of attention is usually determined by subtracting ERPs recorded in an ignore condition from those recorded in an attend condition. This removes the common, exogenous influences (the physical stimulus does not vary between conditions) leaving only the effect of attention. This results in a long-lasting negative wave, Nd. Nd is thought to reflect the additional processing of the attended stimulus. Evidence for the independence of N1 and Nd comes, in part, from the fact that their scalp distributions are different. Components that have different scalp distributions must have different intra-cranial generators. The claim that N1 is independent from Nd is based on the assumption that in ignore conditions, N1 is influenced only by the exogenous, physical characteristics of the stimulus. A problem with any study of attention in the waking and alert human subject is that it is probably impossible to completely ignore a stimulus even if instructed to do so. Thus, there will always be some attentional influences on N1 in the waking state. The period of time that subjects are least aware of their external environment is during an unconscious state, such as sleep. Sleep thus provides an elegant means for sorting out the exogenous and endogenous influences on N1. This study examines the critical sleep onset, marking the transition from a fully awake and conscious state to one of sleep and unconsciousness. The gradual loss of consciousness should have minimal effect on N1, if it is only affected by the physical characteristics of the stimulus. The difference in processing between the waking and sleep states will be computed by subtracting ERPs recorded in definitive sleep (stage 2) from those in the waking state. This should yield a long-lasting negative wave, labeled wNd (waking negative difference) [4,5]. The wNd wave reflects the additional processing of information that occurs in the waking state. Are the scalp distributions of N1 and wNd different? If they are, their intracranial sources must be different. METHODSTen self-reported young adult (M = 14 years) good sleepers spent a single night in the sleep lab. The EEG was recorded from 29 scalp sites and referenced to the tip of the nose. Auditory stimuli were delivered binaurally via earphone inserts. An oddball paradigm was used. Standard 70 dB SPL 1000 Hz tone pips were presented on 96% of trials. On the remaining 4% of trials, a 1500 Hz target was presented. Order of presentation was pseudo-random such that there were 20 to 30 standard tones between target presentations. Subjects were instructed to button press upon detection of the target. Following an initial practice session, the lights were closed and subjects were permitted to fall asleep while attempting to detect the targets. Stimuli were presented throughout the sleep onset period and continued into stage 2 of sleep until a maximum of 600 trials were presented. The duration of the sleep onset period can be very short. For this reason, subjects were repeatedly awakened (10-15 times) in order to increase the number of trials available for signal averaging. Only ERPs following the standard stimulus are quantified. Sleep scoring was conducted by two independent raters using standardized staging procedures. Inter-scorer agreement was above 90%. In the case of stage scoring ambiguity, trials were excluded from analysis. The continuous EEG was classified as either wakefulness, stage 1 or stage 2 sleep using 15 s epochs. RESULTSBehavioural DataThe transition from wakefulness to stage 1 occurred on average within 3.5 min of the onset of stimulus presentation. Subjects detected almost all (94.4%) of targets in the waking state. During stage 1, subjects continued to detect about half (47%) of targets while in stage 2, few detections (2.7%) were made. The mean RT for target detections was significantly faster in the waking state than in stage 1 (746 vs 895 ms, p < .01). RTs were however quite variable during stage 1. Event-Related PotentialsA large N1-P2 complex was observed following the standard stimulus in the waking state (see Figure 1). N1 was maximum over fronto-central areas of the scalp. It peaked at about 90 ms over midline areas and inverted in amplitude at inferior, posterior sites. A later negativity peaking at about 135 ms was observed over temporal regions. N1 declined in amplitude in stage 1 and was at baseline in stage 2. On the other hand, P2, peaking at about 180 ms increased in amplitude from the waking state to stage 1. Also, a late negative wave peaking at about 310 became apparent as the subject entered stage 2. This negative wave was not observed in the waking state.
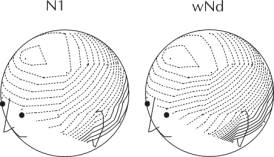
Figure 1. Grand average ERPs following the standard stimulus. The mid-line, temporal and mastoids electrodes are shown. Note that N1 gradually decreases in amplitude as sleep deepens. On the other hand, P2 becomes larger. The ERPs to the standards occurring in stage 2 (equivalent to an unconscious, ignore condition) were then subtracted from those in the waking state (conscious, attend condition). This yielded a long-lasting negative wave, wNd. The scalp distribution of the peaks of N1 and wNd were graphically illustrated as two-dimensional spherical spline potential maps. As can be observed in Figure 2, the maps of N1 and wNd are essentially identical. The scalp distributions were compared using a repeated measures ANOVA. The scalp distributions of N1 and wNd did not vary. The interaction was not significant.
Figure 2. Scalp distribution of the peak of N1 and wNd (calculated by subtracting the ERPs in stage 2 from those in the waking state). The solid line represents contours for positive voltage and the dashed lines, contours for negative voltages. The interval between contours is 0.2 μV. The scalp distributions of N1 and wNd do not differ. Stage 1 Data Sorted by RT BinSubjects detected approximately one-half of all targets during stage 1. These were sorted into fast, medium and slow RT and no response (miss) bins. When RT was rapid during stage 1, the amplitude of N1 in the 20 standard trials occurring before the target did not significantly differ from those in the waking state. N1 following the standards declined in amplitude as RT following the subsequent target slowed. When the subject failed to respond, N1 was similar to that observed in stage 2. It was near baseline level. N1 following the standard stimulus thus serves as an excellent predictor of the subjects eventual performance in the target detection task. DISCUSSION Stimulus input is massively inhibited during sleep. It has generally been thought that the N1 component of the auditory evoked potential is independent of psychological processes such as attention and consciousness. The present study provides strong evidence that this is not the case. N1 is almost entirely dependent on the subjects level of conscious awareness of the external stimulus. When the subject does not show signs of consciousness (whether this is defined by physiological criteria or by behavioural performance), N1 is at baseline level. The waking P1-N1-P2 complex appears to be overlapped by a relatively long-lasting negative wave, wNd. The appearance of N1 in the waking state may indicate that the subject is unable to ignore the stimulus, even if asked to do so. Of course, factors other than consciousness can also explain the differences in processing in the waking and sleeping states. Acknowledgments: This research was funded by grants by the Natural Science and Engineering Research Council (NSERC) of Canada. REFERENCES[1] R. Näätänen, and T. W. Picton, The N1 wave of the human electric and magnetic response to sound: a review and an analysis of the component structure, Psychophysiology, vol. 24, pp. 375-425, 1987 [2] M. Scherg, and D. Von Cramon Two bilateral sources of the late EP as identified by a spatio-temporal dipole model, Electroenceph. Clin. Neurophysiol., vol. 62, pp. 32-44, 1985. [3]R. Näätänen, Attention and Brain Function. Hillsdale, NJ, Erlbaum, 1992. [4] K. Campbell, K., I. Bell, and C. Bastien, C. Evoked potential measures of information processing during natural sleep. In: R. Broughton and R. Ogilvie (Eds.) Sleep, Arousal and Performance. Cambridge, MA, Birkhauser Boston, 1992. [5] K Campbell, Information processing during sleep onset and sleep . Cdn J of Exptl Psy., vol. 54, pp. 209-218, 2000.
© International Society for Bioelectromagnetism
|