H. Zhang*, A.V. Holden* and M.R. Boyett
* School of Biomedical Sciences,
University of Leeds, Leeds, United Kingdom
Introduction
The sinoatrial node (SA node) is the pacemaker
of the heart. It initiates rhythmical action potentials in the heart. Mathematical
models have been produced of the electrical activity of the SA node [ 7
, 9 , 24 , 31
]. These models are of a typical SA node action potential, and ignore the
heterogeneities of the SA node in functions, anatomy and electrophysiology
[ 2 , 3 , 6 ,
8
, 12 , 16 , 20
, 25 , 28 , 29
], which are essential for modelling accurately the initiation and propagation
of the action potentials in the heart. Models incorporating the regional
differences within the SA node activity have been developed [ 24
, 32 ]. These models were based on speculation,
because of the absence of data at the time on regional differences in ionic
currents. Recently, based on experimental data of the kinetics of ionic
channels, the ionic current densities and their regional differences, models
of action potentials for central and peripheral SA node cells have been
developed [ 35 ]. The model action potentials have
the same characteristics and regional differences as those recorded experimentally
[ 12 ]. Here we used the newly developed models [ 35
] to investigate the ionic basis underlying the spontaneous activity of
SA node cells, and their regional differences. We also studied the integrated
behaviours of an intact SA node model, which incorporates the regional
differences in the electrophysiological properties of SA node [ 4
, 12 , 13 , 16
, 17 , 18 , 19
, 22 ]. We show that gradient distributions in
the ionic current densities of SA node cells are responsible for the regional
differences in their electrical activities and responses to ionic channel
blockers. Such differences underlie the dynamical behaviours of the intact
SA node, such as the pacemaker shift in response to a variety of interventions
[ 25 ].
Methods
Heterogeneity of the SA node
The SA node is a heterogeneous tissue. Cells in the centre are smaller
and have fewer and more poorly organised myofilaments than cells in the
periphery [ 2 ]. Electrical activities recorded from the
intact SA node or small pieces of tissue have shown that in the centre,
the take-off potential is more positive, the action potential upstroke
velocity is slower, the action potential duration is longer, the maximum
diastolic potential (also resting potential in quiescent tissue) is more
positive, and pacemaking rate is paradoxically slower than in the periphery
[ 16 , 18 , 25
]. In normal circumstance, the action potential is first initiated in a
small part of the SA node, called the leading pacemaker site, which is
approximately in the centre of the SA node. Once initiated, the action
propagates towards the periphery and then the atrial muscle. The propagation
is asymmetric. The action potentials propagate preferentially towards the
upper crista terminalis direction, but is blocked in the block zone in
the septum direction. The action potentials then encircle the SA node,
and re-excite the SA node in the block zone [ 3 ]. The
block zone is functionally important, because it protects the sinoatrial
node from invasion by arrhythmias. The leading pacemaker site is dynamic.
In response to a variety of interventions, for example autonomic nerve
stimulation, the leading pacemaker site shifts from the centre and in many
cases it shifts towards the periphery [ 25 ]. (see
movie 1(Spread of depolarisation from
the sinoatrial node (mpeg file); movie 2 (Spread
of action potential (mpeg file))
Regional differences in current densities - experiments vs. model
The electrical activity varies from the centre to the periphery of the
intact SA node in a characteristic fashion [ 16 ]. Such
a variation could be explained by a gradual decrease of the atrial modulation
[ 5 , 30 , 33
] from periphery to centre of SA node. However atrial modulation cannot
explain the remarkable differences of electrical activities in small balls
cut from different regions of SA node (in which the large mass of surrounding
atrial muscle is removed) [ 16 , 25
]. There are two radically different interpretations to explain such regional
differences. One is the MOSAIC model [ 29 ]. In
the MOSAIC model, it has been conjectured that the electrophysiological
properties of individual pacemaker cells in the node are uniform and the
apparent regional differences in electrical activity in the intact SA node
are the result of a progressive increase in the percentage of intermingling
atrial cells towards the periphery giving rise to a progressive increase
in their hyperpolarizing influence from centre towards the periphery. However,
the MOSAIC model failed [ 34 ] to generate action potentials
with the same regionally dependent characteristics as those seen experimentally
[ 16 , 25 ]. The other one is
the gradient model [ 6 ]. In the gradient model,
it is believed that the regional differences in the electrical activity
are due to a gradient distribution of ionic current densities in cells
from periphery to the centre of the SA node [ 6 ].
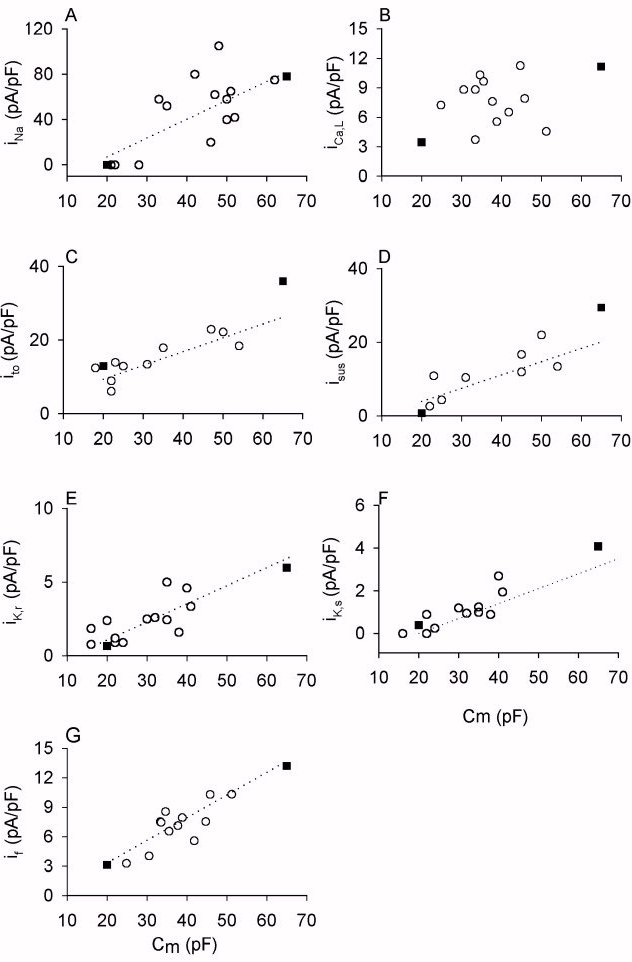
Figure 1. Correlation of ionic current density and cell capacitance.
Ionic current densities are plotted against the cell capacitance for
adult rabbit sinoatrial node cells. Open circles: experimental data. Solid
squares: values computed from the models. In the models, we assume a cell
capacitance of 20 pF for a central sinoatrial node cell; and of 65 pF for
a peripheral sinoatrial node cell. (A) iNa; (B) iCa,L;
(C) ito; (D) iK,sus; (E) iK,r; (F) iK,s.
Figure 1 shows the densities of various currents plotted against the
cell capacitance, a measure of cell size. Though single cells have not
yet been isolated from the centre and periphery of the SA node, it has
been found that the electrical activity of rabbit SA node cells is correlated
with cell size, and small cells have properties characteristic of the centre
of the SA node and large cells have properties characteristic of the periphery
[12 ]. In the figure, the open symbols are the experimental
data obtained from rabbit SA node cells [ 12 , 13,
19 ]. Figure 1A shows the density of iNa
(measured during a 10 ms pulse to -5 mV from a holding potential of -60
mV), Fig. 1B shows the density of iCa,L (measured during a 300
ms pulse to 0 mV from a holding potential of -40 mV), Fig. 1C shows the
density of ito (measured during a 200 ms pulse to +50 mV from
a holding potential of -60 mV), Fig. 1D shows the density of 4-AP-sensitive
sustained current (measured during 200 ms pulse to +50 mV from a holding
potential of -60 mV), Fig. 1E shows the density of iK,r (measured
as the peak tail current during a 1 s pulse to -10 mV from a holding potential
of -50 mV), Fig. 1F shows the density of iK,s (measured as the
peak tail current during a 1 s pulse to +40 mV from a holding potential
of -50 mV) and Fig. 1F shows the density of if (measured at
the end of a 300 ms pulse to -110 mV from a holding potential of -40 mV).
The densities measured experimentally of all currents are significantly
correlated with cell capacitance and are larger in cells with a higher
capacitance [12 , 13 , 19].
In Figure 1, filled squares are the computed densities of ionic currents
for central (cell capacitance 20 pF) and peripheral (cell capacitance 65
pF) cells with the same protocol as used in experiments. Values for all
the densities of the ionic currents for the peripheral and central SA node
cell models are within the experimental range and are greater in the peripheral
SA node cell model.
Peripheral and central SA node action potentials - experiments vs. model
Figure 2A, B shows the action potentials generated using the models
at fast (Fig. 2A) and slow (Fig. 2B) time bases. For comparison, Fig. 2C,
D shows action potentials recorded experimentally from rabbit SA node preparations.
Figure 2C shows action potentials at a fast time base recorded from small
balls of tissue from the periphery and centre of the SA node at a temperature
of 32°C. Figure 2D shows action potentials at a slow time base recorded
from single cells with capacitances of 22.5 and 55 pF at a temperature
of 35°C. The simulated action potentials are similar to those recorded
experimentally. The model peripheral action potential has a more negative
take-off potential, a more rapid upstroke, a more positive peak value,
a greater amplitude, a shorter duration and a more negative maximum diastolic
potential than the model central action potential. Furthermore, the spontaneous
activity of the peripheral cell model is faster than that of the central
cell model. All of these are characteristic differences seen experimentally,
either between small balls of tissue from the periphery and centre of the
rabbit SA node [ 16 ] or large and small rabbit SA node
cells [ 12 ] and can be seen in Fig. 2C, D. The action
potential from the peripheral SA node model has an early rapid phase of
repolarization (phase 1) after the action potential upstroke. Such an early
rapid phase of repolarization after the action potential upstroke can be
observed frequently in the periphery of the intact SA node (not in the
centre) and in small balls of tissue from the periphery (not from the centre)
[ 4 , 22 ].

Figure 2. Simulated peripheral and central SA node action
potentials. The action potentials of central and peripheral sinoatrial node cells.
(A) generated by the models at a fast time base. (B) generated by the models
at a slow time base. (C) recorded from small balls from centre and periphery
of rabbit SAN at a fast time base. (D) recorded from single cells of rabbit
SAN at a slow time base (from Zhang et al. [ 35 ]).
In Figure 3 we compare the characteristics of the simulated action potentials
with the characteristics of action potentials recorded experimentally from
a set of rabbit SA node cells from [ 12 ] at 35°C.
In Fig. 3, the open circles show experimental data from [ 12
] - the take-off potential (TOP) (Fig. 3A), maximal upstroke velocity of
the action potential (dV/dt) (Fig. 3B), action potential amplitude (Fig.
3C), action potential duration (Fig. 3D) (APD), maximal diastolic potential
(MDP) (Fig. 3E) and cycle length (CL) (time between successive spontaneous
action potentials; Fig. 3F) of single rabbit SA node cells are plotted
against the cell capacitance, Cm. In all cases (except for action
potential duration) there are significant correlations of the variables
with Cm. In Fig. 3, the filled squares show corresponding values
from the peripheral and central cell models. In all cases, the model values
are close to those recorded experimentally; the changes with cell capacitance
are also comparable to those seen experimentally. Although no correlation
was observed experimentally between action potential duration and Cm
in rabbit SA node cells, there was a difference in action potential duration
in the peripheral and central cell models (Fig. 3D). However, the action
potential duration in the peripheral and central cell models are still
comparable to the data from rabbit SA node cells (Fig. 3D) and, furthermore,
in small balls of tissue from the periphery and centre of the rabbit SA
node a regional difference in action potential duration is observed [4]
similar to that between the peripheral and central SA node cell models (Fig. 3D).

Figure 3. Correlation of action potential characteristics and
cell capacitance. The comparison of the characteristics of action potentials of central
and peripheral sinoatrial node cells between simulation and experiment.
Open circle: data obtained from adult rabbit sinoatrial node cells; Solid
square: values computed from models. Once again, in the model, we assume
the cell capacitance of a central sinoatrial node cell is 20 pF, and a
peripheral cell 65 pF. The values computed from models are consistent with
those obtained experimentally. (A) take-off potential (TOP). (B) maximal
upstroke velocity. (C) amplitude of action potential. (D) action potential
duration (APD). (E) maximal diastolic potential (MDP). (F) spontaneous
pacemaking cycle length (CL) (from Zhang et al. [35]).
Role of each ionic current in the pacemaker activity
The pacemaking activity of SA node cell is the cooperative effect of
all individual ionic channel currents. To analyse the role of each individual
current in the pacemaking activity, we look at the effect of blocking the
current on the action potentials.
(a) Role of iNa. Figure 4A shows the effect of block
of iNa on peripheral (left panel) and central (right panel)
action potentials. Blocking iNa had no effect on the central
action potential. In contrast, blocking iNa had various effects
on the peripheral action potential: (i) the take-off potential was shifted
to a more positive potential; (ii) the upstroke velocity of the action
potential was dramatically reduced after block of iNa from 60
to 8 V/s - after block of iNa, the upstroke velocity in the
periphery was approximately the same as that in the centre); and (iii)
as a result of the change in the take-off potential, spontaneous activity
was slowed after block of iNa.
In the peripheral cell model, block of iNa also reduced the
peak value of the action potential, the action potential duration and the
maximal diastolic potential; these changes are also seen experimentally
in small balls of tissue from the periphery of the rabbit SA node tissue
[18].
In conclusion, iNa mainly contributes in the depolarisation
phase and is responsible for a large upstroke velocity of action potentials.
In the peripheral SA node tissue, unlike that in central SA node tissue,
pacemaking is sensitive to block of iNa.
(b) Role of iCa,L. Figure 4B shows the effect of
block iCa,L (simulation of Nifidipine) on peripheral (left)
and central (right) action potentials. In simulation, block of iCa,L
abolished the action potential in the centre of the SA node: the membrane
potential settled at -42 mV (this is very close to that seen experimentally,
in which membrane potential settled at -45 mV [18]). In contrast, in the
periphery block of iCa,L had different effects on electrical
activity. Block of iCa,L: (i) shortened the action potential;
(ii) increased the pacemaking rate (presumably as a consequence of the
shortening of the action potential); in the simulation, block of iCa,L
causes a 22.5 % increase in the pacemaking rate (similar to that seen in
experiments, 2 M nifedipine caused a 21 ± 1 %, mean ±
SEM, n=15, increase in the pacemaking rate [18]); (iii)
decreased the maximal upstroke velocity and (v) decreased the overshoot
of the action potential. In the simulation, block of iCa,L caused
a decrease of maximal upstroke velocity from 60 to 40 V/s and a decrease
in the peak of the action potential from 27 to 8 mV (in experiments, on
the application of 2 M Nifedipine, the maximal upstroke velocity was decreased
from 82 to 75 V/s, and the peak of the action potential was decreased from
22 to 6 mV [18]).
In conclusion, pacemaking in the central SA node tissue, unlike that
in peripheral SA node tissue, is sensitive to block of iCa,L.
(c) Role of iCa,T. Figure 4C shows
the effect of block of iCa,T (simulation of Ni+).
Hagiwara et al. (11) reported that block of iCa,T by 40 mM Ni2+
produced on average a 14.4 % increase in the cycle length in rabbit SA
node cells. In simulation, both the peripheral (left) and central (right)
SA node cell models, block of iCa,T caused a small increase
in cycle length of 4 and 19 % respectively, similar to that reported experimentally
[11]. In simulations, block of iCa,T
has very little effect on peripheral model action potential, but has different
effects on central model action potential: (i) shortened the action potential
duration; (ii) decreased the amplitude; (iii) increased the maximal diastolic
potential.
(d) Role of iK,r Figure 4D shows the effect of block
of iK,r (simulation of E-4031) on peripheral and central action
potentials. In simulation complete block of iK,r caused the
cessation of spontaneous activity in peripheral and central tissue. After
complete block of iK,r, the membrane potential settled at -33
mV in the peripheral cell model, and -30.3 mV in the central cell model,
this is similar to that seen experimentally (the membrane potential settled
at -34.96±1.94 mV on average in rabbit peripheral SA node tissue,
at -32.04±1.95 mV on average in rabbit central SA node tissue [17]).
This shows that, in both the periphery and centre, iK,r is important
for pacemaking. iK,r is responsible for generating the maximum
diastolic potential, and thus when iK,r is blocked, the membrane
during diastole is depolarised and spontaneous activity ceases.
Partial block of iK,r has different effects on the action
potentials in peripheral and central rabbit SA node tissue. With iK,r
blocked by 50%,it abolishes the action potentials in central tissue, but
not in peripheral tissue. In the periphery cell model, partial block of
iK,r: (i) increase action potential duration; (ii) increases
the cycle length; and (iii) decreases the maximal diastolic potential.
This is similar to that seen experimentally [17]
(e) Role of 4-AP-sensitive current. Figure 4E shows the effect
of block of 4-AP-sensitive current on peripheral (right) and central (left)
action potentials. 4-AP blocks both transient and sustained outward current,
ito and iK,sus. The effect of 4-AP was simulated
by blocking both ito and iK,sus (and 10% iK,r).
In the simulation, 4-AP caused (i) prolongation of the action potential
in both peripheral and central cells. In simulations, 4-AP caused an increase
of 50% in APD for the peripheral cell model, and 21% for the central cell
model (experimentally 5 mM 4AP increased the APD by 66±4% for small
ball from periphery, 25±5% for small ball from centre of rabbit
SA node (13)); (ii) an increase in the action potential overshoot; (iii)
an increase in the cycle length in the peripheral tissue and a decrease
in cycle length in the central tissue. In the simulation, 4-AP caused about
3.0% decrease in the cycle length for the central cell model, about 26.5%
increase in the cycle length for the peripheral cell model (experimentally,
5 M 4-AP caused an decrease of 4.5±2% in cycle length in small ball
from centre, an increase of 28±6% of cycle length in small ball
from periphery [13]).
It can be concluded that 4-AP-sensitive current plays a major role in
action potential repolarization and its role varies regionally.
(f) Role of iK,s Complete block of iK,s has
very little effect on the pacemaker activity of both peripheral and central
cell models.
(g) Role of if. Figure 4F shows the effect of block
of if (simulation of Cs+) on peripheral and central
action potentials. Block of if slowed spontaneous activity and
the slowing was greater in the periphery. In the simulations, block of
if caused a 34 % increase in the cycle length in the peripheral
cell model and a 7.6 % increase in the central cell model (in experiments,
block of if caused on average a 25 % in peripheral tissue and
a 7 % in central tissue [21, 22]).
In the simulations at least, the greater effect of block of if
on the peripheral SA node cell model can be explained by the greater density
of if in the peripheral model.

Figure 4. A. Effect of block of iNa. Blocking iNa
has no effect on the pacemaker activity of the central SA node cell, but
slows down the pacemaker activity of the peripheral SA node cell. B. Effect
of block of iCa,L. Blocking iCa,L abolished the action
potential for the central SA node, but in the peripheral SA node, the pacemaker
activity maintains, with a faster rate, and a small action potential duration.
C. Effect of block of iCa,T. Blocking iCa,T slows
down the pacemaker activity of SAN cells. D. Effect of block 4-AP-sensitive
current. Blocking 4AP-sensitive current causes the prolongation of action
potential durations for both central and peripheral sinoatrial node cells,
increases the pacemaker activity rate in the centre, but slows down the
pacemaker activity rate in the peripheral. E. Effect of block iK,r.
Blocking iK,r abolished the action potential for the central
SA node, but in the peripheral sinoatrial node, the pacemaker activity
maintains, with a slower rate, and a larger action potential duration.
F. Effect of block of if. Blocking if slows down
the pacemaker activity in both the central and the peripheral sinoatrial
node. The effect in the peripheral is significant, while in the centre
is small.
Model of Intact sinoatrial node
It is known that the functioning of the SA node is not only dependent
on the properties of the cells making up the SA node - it is also dependent
on the multicellular nature of the SA node and the electrotonic interaction
between the SA node and the atrial muscle surrounding the SA node [15].
Based on the models developed for peripheral and central SA node cells
[35], a one-dimensional partial differential equation
of multicellular model for the SA node and atrium was developed. In the
model, the multicellular SA node and atrium is modelled as a string of
cells with a length L; of this the string of SA node cells has a length,
LS, of 3.0 mm (similar to the distance from the centre of the
SA node to the atrial muscle in the rabbit heart [2])
and the string of atrial cells has a length, La, of 9.6 mm.
Within the string of SA node cells, we assume that the capacitance changes
from 20 (cell capacitance in central cell model) to 65 (cell capacitance
in peripheral cell model) pF exponentially (see Fig. 6A) and the densities
of ionic currents for each cell are functions of its capacitance. In the
model, single atrial cells are represented by the Earm-Hilgemann-Noble
equations [23]. Electrotonic interactions between cells
are modelled by the diffusive interactions of membrane potentials. The
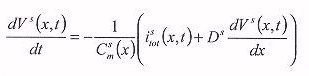
equations for the one-dimensional model
where superscript s denotes SA node, superscript a denotes atrial muscle,
Csm or Cam(x) is the capacitance
of a cell x mm distant from the centre of the SA node, Vs or
Va(x,t) is its membrane potential, t is the time, Istot
or Iatot(x,t) is the total current, and Ds
or Da is the coupling coefficient which models the electrotonic
interactions between SA node cells or atrial cells, respectively. Ds
and Da scale the conduction velocity of the action potential
in the SA node and the atrial muscle, respectively. The velocity for near
planar waves in the SA node is about 0.001 - 0.1 m/s, and in the atrium
about 0.3-0.8 m/s [10]. Efficient numerical solution
requires different space steps for SA node and atrial muscle, dxs
and dxa, respectively. We use non-flux boundary conditions for
both ends of the model. Coupling at the junction of the SA node and atrial
muscle is by a junctional coupling coefficient Ds. To solve
the partial differential equation, we use the explicit Euler method with
a 3-node approximation of the Laplacian operator [26].
We fixed dxsat 0.1 mm, dxaat 0.3 mm and dt at 0.1 ms.
We used Da = 1.25 cm2/s, which gives a conduction
velocity of a solitary planar wave of 0.6 m/s in the atrial fiber, and
Ds = 0.6 cm2/s, which gives a spatial distribution
of activation time for cells in the SA node tissue model consistent with
the data obtained from the rabbit heart [16].
Figure 5A shows action potentials computed using the one-dimensional
model of the intact SA node. Action potentials from various points along
the string of cells are shown. The boundary of the SA node and atrium is
shown at 0 mm. Figure 5A shows that spontaneous action potentials were
first initiated in the centre of the SA node +3 mm from the border of the
SA node with the atrial muscle - the action potential then propagated to
the periphery of the SA node and then onto the atrial muscle. The activation
time is shown in Fig. 6C. This is similar to the activation sequence seen
experimentally [16]. The rate of spontaneous action potentials
in the one-dimensional model of the intact SA node is 171 beats/min; this
is lower than the rate in either the peripheral (384 beats/min) or central
(180 beats/min) cell models. However, the rate of spontaneous activity
in the one-dimensional model of the intact SA node is comparable to that
observed experimentally in the intact SA node of the rabbit, ~170±24
beats/min [25]. The SA conduction time (time for the
action potential to conduct out of the SA node) was 45 ms, similar to that
seen clinically [1].
Fig. 5B shows how the space constant of the string of rabbit SA node
cells was measured - a 2 ms constant current pulse was injected into a
SA node cell 2.0 mm from the boundary of the SA node with the atrial muscle.
The current was injected during diastole to depolarize the cell at the
point of injection by 17 mV. The same technique has been used experimentally
[3]. Figure 5B shows that the amplitude of the depolarization
declined away from the point of injection. In Fig. 6B, the amplitude of
the resulting depolarization is plotted against the distance from the point
of injection. The exponential decline in the amplitude of depolarization
yields a space constant, l of 0.387 mm; this compares to space constants
of 0.380 to 0.370 mm measured experimentally in the rabbit SA node [3].
Figure 5A shows that the action potential changes progressively from
the atrial muscle to the centre of the SA node. This is confirmed by Fig.
6D, E, F. Figure 6D shows superimposed action potentials at a fast time
base at various points along the string of cells; the recordings are comparable
to the equivalent experimental recordings [16]. Figure
6E, 6F show various action potential parameters plotted against the distance
from the border of the SA node and atrial muscle. The model data are comparable
to the experimental data [16].

Figure 5. One-dimensional model of the SA node.
The propagation of pacemaker activity in the one-dimensional model
of sinoatrial node - atrial muscle fibre. A. Computed action potentials
are displayed along the length of string of SA node and atrium. 0: mm,
the boundary between SA node and atrium; +3.0 mm: the centre of SA node;
-9.6 mm, end of atrial string. Action potential is first initiated in the
centre of SA node (arrow) and propagates via periphery to atrial muscle.
B. Decay of response to 2 ms, 17 mV constant current pulse injected into
a SA node cell during diastole 2.0 mm from the boundary of the SA node
with the atrial muscle. The amplitude of the depolarization declined away
from the point of injection.
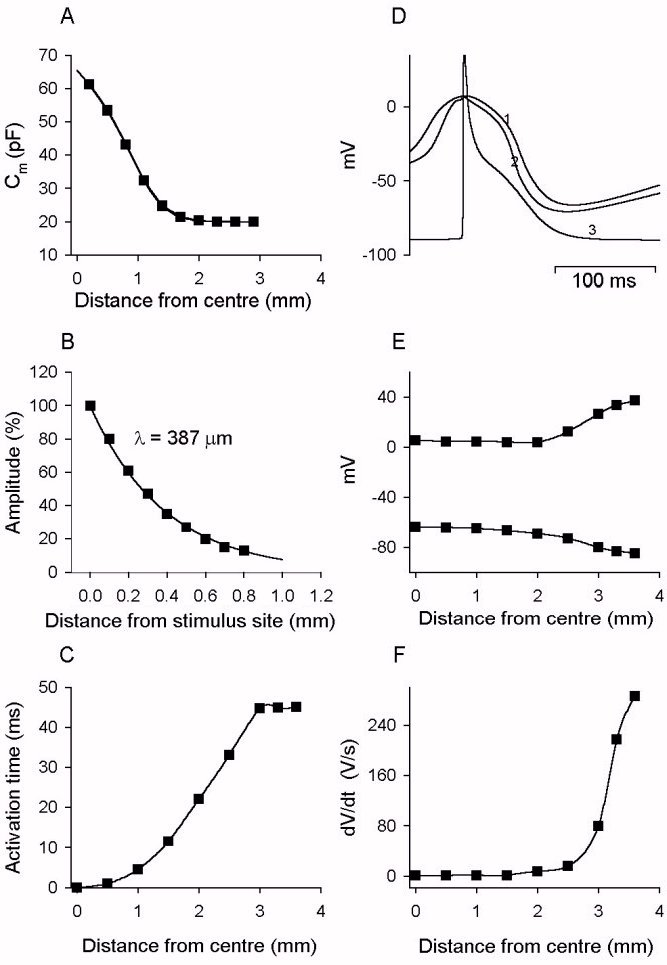
Figure 6. Spatial distributions of characteristics of action
potentials along the one-dimensional model.
A. spatial distribution of cell membrane capacitance along the SA node
fibre. B. spatial distribution of response to a subthreshold stimulus (2
ms in duration) delivered to a point 2mm distance from the border of SA
node and atrial muscle during diastolic phase. The decay of the response
gives a measure of the space constant of the model. C. spatial distribution
of activation time by which the action potential reaches the SA node cells.
D. action potentials recorded from cells in different regions in the model
fibre. 1: central SA node cell. 2: transitional SA node cell. 3: atrial
cell. E. spatial distribution of the overshoot and maximal diastolic potential
of action potentials along the fibre. F. spatial distribution of the maximal
upstroke velocity of action potentials along the fibre.
Pacemaker shift in mammalian rabbit heart
Figure 7 shows the simulations of the effect of blocking of iCa,L
(simulation of Nifidepine) to the pacemaker activities of the centre
SA node. The propagation of pacemaker activities under control condition
is shown in panel A. In the control case, the pacemaker activity is initiated
at the centre of SA node as pointed by the arrow. In the application of
Nifidipine, shown in panel B, which is modelled by blocking iCaL
by 50%, the action potential in the centre is abolished, and the leading
pacemaker site shifts 2.3 mm towards the periphery of the SA node. This
is similar to that observed experimentally [6] and in
the model is the result of the presence of TTX-sensitive Na+
current, iNa, in the periphery, but not the centre, of the SA
node: in the periphery, iNa sustains pacemaker activity after
partial block of iCa,L.

Figure 7. Simulated pacemaker shift by blocking iCa,L.
Computed action potentials are displayed along the length of string
of SA node and atrium. 0: mm, the boundary between SA node and atrium;
+3.0 mm: the centre of SA node; -9.6 mm, end of atrial string. (A) Action
potentials under control condition. Action potential is first initiated
in the centre of SA node (arrow) and propagates via periphery to atrial
muscle. (B) action potentials after 50% block of L-type Ca2+ current. The
action potential in the centre is abolished and the leading pacemaker site
(arrow) shifts 2.3 mm towards the periphery of SA node.
A hypothesis to explain the conduction block zone:
Mechanism underlying the conduction block zone in SA node is unclear
yet. Possible explanations for the block zone are (i) low excitability
of cells in the zone and (ii) weak electric coupling between cells in the
zone. Experiments have failed to find evidence for weak electric coupling
between cells in the block zone [3] and we

Figure 8. Schematic illustration of a ring model of rabbit sinoatrial
node and atrium muscle.
propose that the block zone is the result of low excitability of cells
in the zone caused by the absence of the L-type Ca2+ current.
To test this hypothesis, we constructed a one-dimensional ring model of
intact SA node and atrial muscle. The model is schematically illustrated
in Figure 8. In the model, the block zone is modelled by removing the L-type
Ca2+ current, iCaL, from a 1 mm region of the SA
node.

Figure 9. The propagation of action potentials in the one-dimensional
ring model of the sinoatrial node and the atrial muscle.
A. Symmetric conduction without conduction block zone. The action potential
is first initiated in the centre of the sinoatrial node (0 mm), and then
propagates towards the periphery (+3 mm) in the direction of CT (+7.5 mm)
and towards the periphery (-3 mm) in the direction of AS. B. Asymmetric
conduction with a conduction block zone. The action potential is first
initiated in the centre of the sinoatrial node (0 mm), and then propagates
towards the periphery (+3 mm) in the direction of CT (+7.5 mm). Conduction
of action potential towards the periphery (-3 mm) in the direction of AS
(-7.5 mm) is blocked due to the block zone caused by removing the L-type
Ca2+ in the zone. Action potentials conducted from CT to AS
by the ring is also blocked to enter SAN.
Figure 9 shows the propagation of pacemaker activity in the model of
a ring of SA node and atrial muscle cells. In the control case, in which
there is no conduction block zone, as shown in Fig. 9A, the conduction
is symmetric. The pacemaker activity is first initiated in the centre of
SA node (0 mm) and then conducts to the periphery of SAN next to the crista
terminalis (CT) and the periphery of SAN next to the atrial septum (AS),
then onto the atrial muscle. In the test case, as shown in Fig.9B, the
conduction is asymmetric. The pacemaker activity is first initiated in
the centre of SA node (0 mm) and then conducts to the periphery of SAN
next to the crista terminalis (CT) and then onto the atrial muscle of the
crista terminalis, conduction of action potentials from the centre of the
SA node to the atrial muscle of the atrial septum is blocked in the region
lacking the L-type Ca2+ current. The atrial septum is activated
as a result of the action potential propagating from the crista terminalis
around the ring of atrial muscle (equivalent to the situation observed
experimentally). The action potential attempts to conduct retrogradely
from the atrial septum to the SA node, but it is again blocked in the region
lacking the L-type Ca2+ current.
Figure 10 shows action potentials recorded from different regions of
the model of a ring of SA node and atrial muscle. The AP recorded from
the block zone shows a small two-component depolarization. The small two-component
depolarization is the result of the collision of action potentials conducted
from the centre of the SA node and the atrial septum. Similar small two-component
depolarizations are observed in the block zone experimentally [3].

Figure 10. The recorded action potentials from different regions
of the one-dimensional ring model of sinoatrial node and the atrial muscle.
Action potentials recorded from the block zone show a small two-component
of repolarization, which is similar to that seen experimentally.
Biophysically detailed models of electrical activity of central and
peripherial sinoatrial node cells are constructed based on the voltage-clamp
experimental data from isolated cells of rabbit heart.
Conclusions
The model generated action potentials for the
peripheral and central SA node cell are comparable to those recorded from
peripheral and central tissue from the rabbit SA node
[6,16]
as well as those of large and small rabbit SA node
cells [12]. Our modelling work validates the assumption
that Cm is an indicator of the region of origin of cells as
the models are based on current densities of rabbit SA node cells of different
Cm rather than cells isolated from the periphery and centre
of the SA node. Experimental work has shown that block of iNa,
4-AP-sensitive current and if has greater effects in peripheral
rabbit SA node tissue, whereas block of iCa,L and iK,r
has greater effects in central rabbit SA node tissue [4,
6,
17,
18,
21,
22].
From this indirect evidence, it was argued that the densities of iNa,
4-AP-sensitive current, iK,r and if are greater in
the periphery than the centre [4,
6,
17,
18,
21,
22].
The modelling was able to support this interpretation, because in the peripheral
and central SA node cell models, in which the densities of iNa,
4-AP-sensitive current, iK,r and if are greater
in the periphery than the centre, the effects of block of these currents
as well as iCa,Lare qualitatively similar to those seen experimentally.
Block of iCa,L is a special case - block of iCa,L
has a greater effect on the centre than on the periphery as a result, in
the simulations at least, of the absence of iNa in the centre
(in the peripheral model, after block of iCa,L, iNa
is able to support the action potential.
Acknowledgements
This work is supported by a programme grant from
British
Heart Foundation.
References
[1] Alings, A.M.W. and Bouman, L.N., "Electrophysiology
of the ageing rabbit and cat sinoatrial node - comparative study", European
Heart Journal 14: 1278-1288, 1993.
[2] Bleeker, W.K., Mackaay, A.J.C., Masson-Pevet, M.,
Bouman, L.N. and Becker, A.E., "Functional and morphological organization
of the rabbit sinus node", Circ.Res. 46: 11-22, 1980.
[3] Bleeker, W.K., Mackaay, A.J.C., Masson-Pevet, M.,
Op't Hof, T., Jongsma, H.J. and Bouman, L.N., "Asymmetry of the sino-atrial
conduction in the rabbit heart", J. Mol. Cell. Cardiol. 14: 633-643,
1982.
[4] Boyett, M.R., Honjo, H., Yamamoto, M., Niwa,
R. and Kodama, I., "Regional differences in the effects of 4-aminopyridine
within the sinoatrial node", Am. J. Physiol. 44: H1158-H1168, 1998.
[5] Boyett, M.R., Holden, A.V., Kodama, I.,Suzuki, R.
and Zhang, H., "Atrial modulation of sinoatrial pacemaker rate", Chaos,
Soliton& Fractals 5: 425-438, 1995.
[6] Boyett, M.R., Honjo, H. and Kodama, I., "The sinoatrial
node: heterogeneous pacemaker structure" Circulation Res. (in press) 2000.
[7] Demir, S.S., Clark, J.W., Murphey C.R. and Giles,
W.R., "A mathematical model of a rabbit sinoatrial node cell", Am. J. Physiol.
266: C832-C852, 1994.
[8] Denyer, J.C. and Brown, H.F., "Rabbit sino-atrial
node cells: isolation and electrophysiological properties", J. Physiol.
428: 405-424, 1990.
[9] Dokos, S., Celler, B.G. and Lovell, N.H., "Modification
of DiFrancesco-Noble equations to simulate the effects of vagal stimulation
on in vivo mammalian sinoatrial node electrical activity", Annals of Biomedical
Engineering 21: 321-335, 1999.
[10] Fozzard, H.A., Haber, E., Jennings, R.B. and Katz,
A.M., "The heart and the cardiovascular system", New York: Raven press,
1991.
[11] Hagiwara, N., Irisawa, H. and Kameyama,
M., "Contribution of two types of calcium currents to the pacemaker potentials
of rabbit sino-atrial node cells", J. Physiol. 395: 233-253, 1988.
[12] Honjo, H., Boyett, M.R., Kodama, I. and Toyama,
J., "Correlation between electrical activity and the size of rabbit sinoatrial
node cells", J. Physiol. 496: 795-808, 1996.
[13] Honjo, H., Lei, M., Boyett, M.R. and Kodama, I.,
"Heterogeneity of 4-aminopyridine sensitive current in rabbit sinoatrial
node cells", Am .J. Physiol. 276: H1295-H1304, 1999.
[14] Joyner, R.W. and van Capelle, F.J.L., "Propagation
through electrically coupled cells: how a small SA node drives a large
atrium", Biophys. J. 50: 1157-1164, 1986.
[15] Kirchhof, C.J.H.J., Bonke, F.I.M., Allessie, M.A.
and Lammers, W.J.E.P., "The influence of the atrial myocardium on impulse
formation in the rabbit sinus node", Pflügers Arch. 410: 198-203,
1987.
[16] Kodama, I. and Boyett, M.R., "Regional differences
in the electrical activity of the rabbit sinus node", Pflügers Arch.
404: 214-226, 1985.
[17] Kodama, I., Boyett, M.R., Nikmaram, M.R.,
Yamamoto, M., Honjo, H. and Niwa, R., "Regional differences in the effects
of E-4031 within the sinoatrial node", Am. J. Physiol. 276: H793-H802,
1999.
[18] Kodama, I., Nikmaram, M.R., Boyett, M.R., Suzuki,
R., Honjo, H. and Owen, J.M., "Regional differences in the role of
the Ca2+ and Na+ currents in pacemaker activity in the sinoatrial node",
Am. J. Physiol. 272: H2793-H2806, 1997.
[19] Lei, M., Honjo, H. and Boyett, M.R., "Characterisation
of the transient outward current in rabbit sinoatrial node cells", In press
2000.
[20] Masson-Pevet, M.A., Bleeker, W.K., Besselsen,
E., Treytel, B.W., Jongsma, H.J. and Bouman, L.N., "Pacemaker cell types
in the rabbit sinus node: a correlative ultrastructural and electrophysiological
study", J. Mol. Cell. Cardiol. 16: 53-63, 1984.
[21] Nikmaram, M.R. "Regional differences in
the regulation of the rabbit cardiac pacemaker", Ph.D. thesis. University
of Leeds. 1996.
[22] Nikmaram, M.R., Boyett, M.R., Kodama, I., Suzuki,
R. and Honjo, H., "Variation in the effects of Cs+, UL-FS 49 and ZD7288
within the sinoatrial node", Am. J. Physiol. 272: H2782-H2792, 1997.
[23] Noble, D. Oxsoft manual version 4.8. Oxford. 1990.
[24] Noble, D. and Noble, S.J., "A model of sino-atrial
node electrical activity based on a modification of the DiFrancesco-Noble
(1984) equations", Proc. R. Soc. Lond.B 222: 295-304, 1984.
[25] Opthof, T., Van Ginneken, A.C.G., Bouman, L.N.
and Jongsma, H.J., "The intrinsic cycle length in small pieces isolated
from the rabbit sinoatrial node", J. Mol. Cell. Cardiol. 19: 923-934, 1987.
[26] Press, W.H., Flannery, B.P., Teukolsky, S.A. and
Vetterling, W.T., "Numerical recipies. The art of scientific computing",
Cambridge: Cambridge University Press, 1990.
[27] Schuessler, R.B.,Boineau, J.P., and Bromberg,
B.I., "", Journal of Cardiovascular Electrophysiology 7, 263-274, 1996.
[28] ten Velde, I., de Jonge, B., Verheijck, E.E.,
van Kempen, M.J.A., Analbers, L., Gros, D. and Jongsma, H.J., "Spatial
distribution of connexin43, the major cardiac gap junction protein, visualizes
the cellular network for impulse propagation from sinoatrial node to atrium"
Circ. Res. 76: 802-811, 1995.
[29] Verheijck, E.E., Wessels, A., van Ginneken , A.C.G.,
Bourier, J., Markman, M.W.M., Vermeulen, J.L.M., de Bakker, J.M.T., Lamers,
W.H., Opthof, T. and Bouman, L.N., "Distribution of atrial and nodal cells
within rabbit sinoatrial node. Models of sinoatrial transition", Circulation
97: 1623-1631, 1998.
[30] Watanabe, Ei-Ichi, Honjo, H., Anno, T., Boyett,
M.R., Kodama, I. and Toyama, J. (1996) "Modulation of pacemaker activity
of sinoatrial node cells by electrical load imposed by an atrial cell model",
Am. J. Physiology 38: H1735-1742.
[31] Wilders, R., Jongsma, H.J. and van Ginneken, A.C.G.,
"Pacemaker activity of the rabbit sinoatrial node. A comparism of mathematical
models", Biophys. J. 60: 1202-1216, 1991.
[32] Winslow, R.L., Kimball, A.L., Varghese, A. and
Noble, D., "Simulating cardiac sinus and atrial network dynamics on the
Connect Machine" Physica D 3: 281-298, 1993.
[33] Zhang, H., Holden, A.V. and Boyett. M.R., "The
pacemaking system of the heart: from coupled oscillators to nonlinear waves",
Nonlinear Analysis, Theory, Methods & Applications 30: 1019-1027, 1997.
[34] Zhang, H., Holden A.V., and Boyett, M.R., "Gradient
vs. MOSAIC models of sinoatrial node", Circulation, in press 2000.
[35] Zhang, H., Holden, A.V., Kodama, I., Honjo, H.,
Lei, M., Varghese, T. and Boyett, M.R., "Mathematical models of action
potentials for centre and periphery sinoatrial node of rabbit heart", Am.
J. Physiology (Heart & Circulation), 279 (1): 397-421, 2000.
 Home
Current Issue
Table of Contents
Home
Current Issue
Table of Contents